See every campaign and every agent in real time
Stop refreshing reports. The Command Center streams typed SSE deltas for agent state, campaign KPIs, queue depth, and pacing, and fires alerts the moment something drifts out of spec.
Data channel
Server-Sent Events
Event types
Agent · Campaign · KPI · Queue · Pacing
Alert channels
Telegram · Email · Push
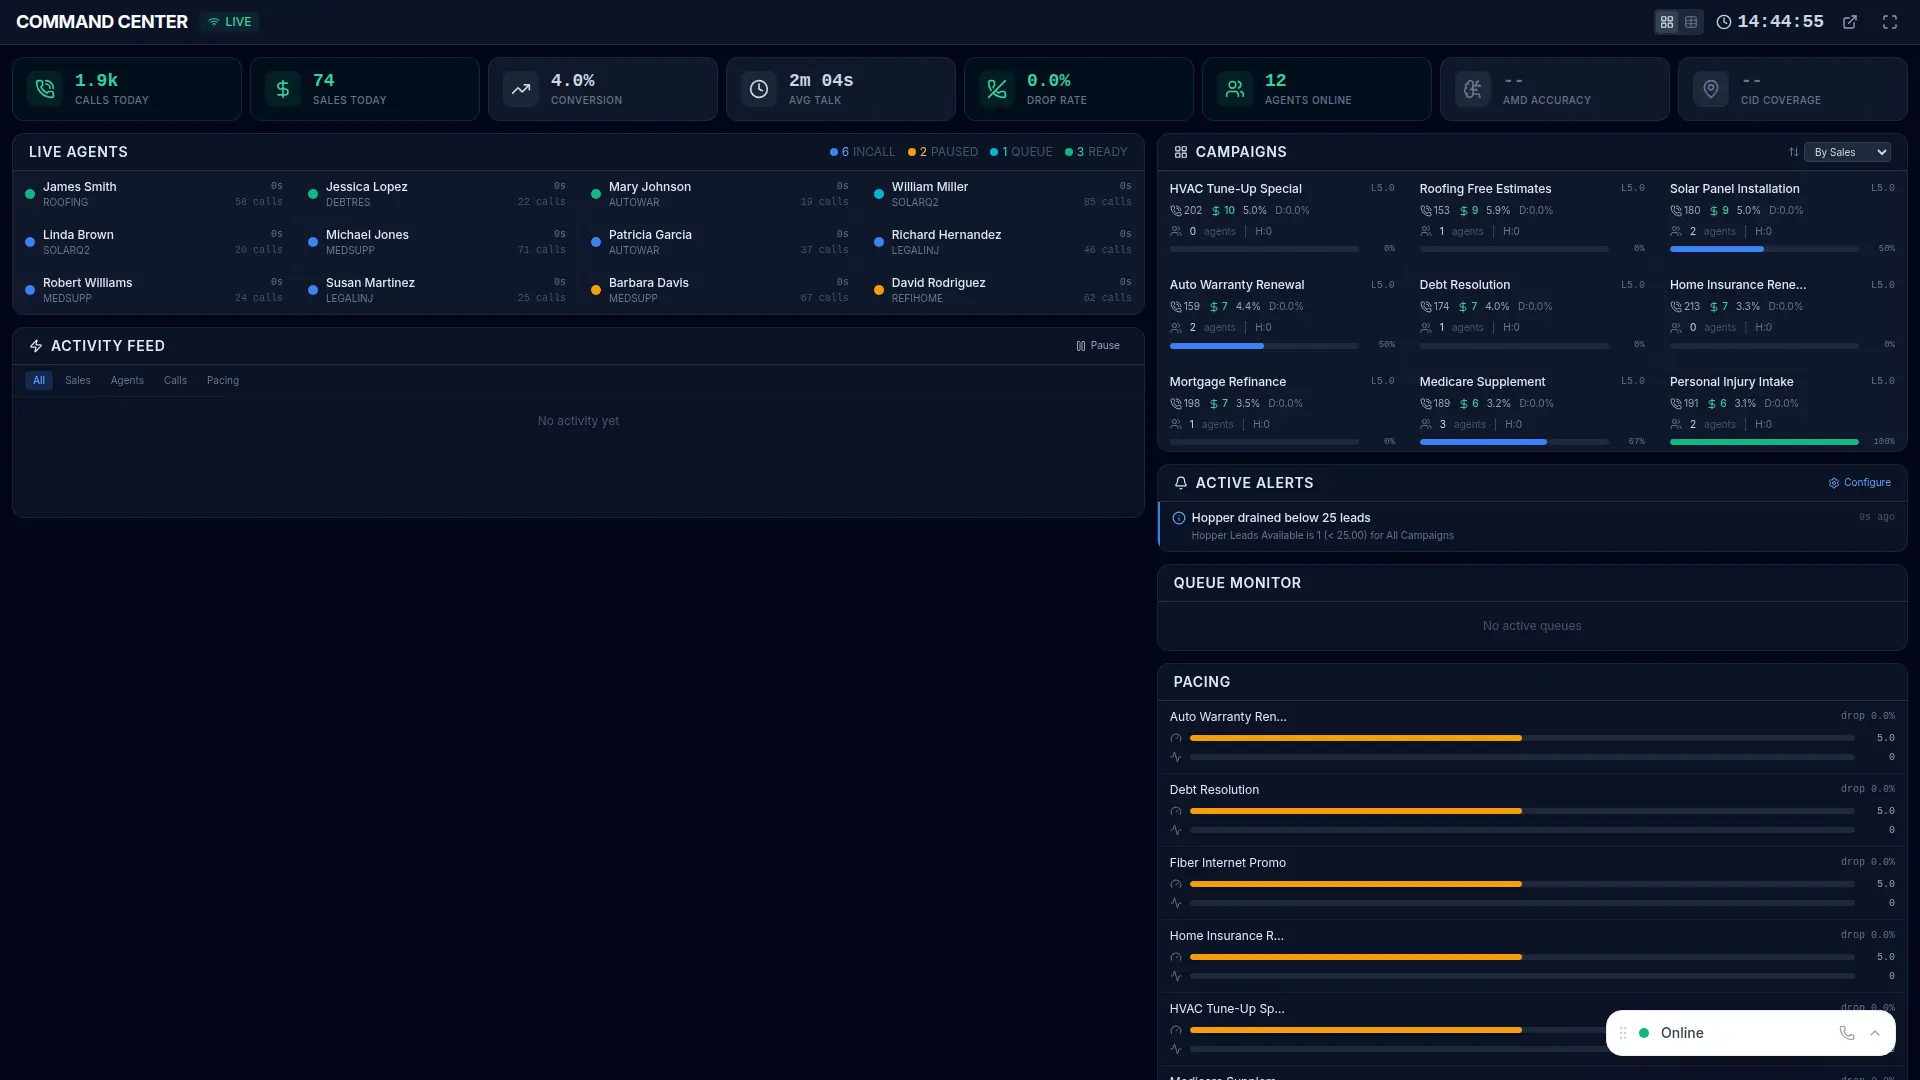
Real-time command center with SSE streaming
Most dashboards refresh every 15-30 seconds. That's fine for a quarterly report, useless for spotting that your drop rate just crossed 3%, or that a carrier route is burning dials silently, or that an agent has been stuck in wrap for the last hour. The Command Center is built differently. It holds an open SSE connection to the server. Every relevant event (agent state, KPI, queue event, pacing decision) arrives as a typed delta within a second of happening. When a metric crosses a threshold you've configured, alerts fire over Telegram, email, and browser push simultaneously.
Command Center in 4 steps
Single-screen NOC surface
Live agent grid, campaign KPIs, queue depth, compliance metrics, pacing signals, all on one page.
SSE delta stream
Browser holds a persistent connection. Server pushes typed events (agent_update, campaign_update, kpi_update, etc.) as they happen.
Configurable alert thresholds
Set your rules per campaign, drop rate over N%, queue depth over M, agent idle over T minutes. Multi-channel delivery.
Action from the same surface
Pause a campaign, force agent logout, trigger pacing adjustment, all from the Command Center without leaving the page.
What makes this different
Built for operations people, not dashboards
Each element is actionable. One click pauses the campaign. One click whispers to the agent.
Alerts that actually reach you
Telegram is there because ops teams actually read it. Email is there for the record. Browser push is there for the moment.
Scales to multi-site ops
Multiple command centers running in parallel, one per region, one per client (for BPOs), all reading from the same SSE backbone.
What VICIPanel command center does differently
SSE stream means sub-second latency, not AJAX polling every 30 seconds
Typed delta events are cheap to process, so the browser stays responsive under load
Action surfaces on the same screen, no context switching to fix problems
Alert channels include Telegram, which ops teams actually read
Other things VICIPanel ships
Real-Time Operations
Wallboard
Preset and custom wallboards designed for the big screen in the room, or the remote agent's dual monitor. Shareable TV URLs, auto-refresh, responsive layouts.
Real-Time Operations
Pacing Engine
Pacing profiles, time-of-day schedules, adaptive dial-level feedback from live drop-rate monitoring, and multi-campaign agent-balancing, all with plain-English controls.
Agent & Supervisor
Supervisor Workspace
Live agent monitoring with listen / whisper / barge, coaching notes tied to specific calls, team dashboards, and structured coaching workflows.
See it running on your VICIdial
The live demo runs on real VICIdial data. Try everything above, instant credentials, no signup, no sales call.